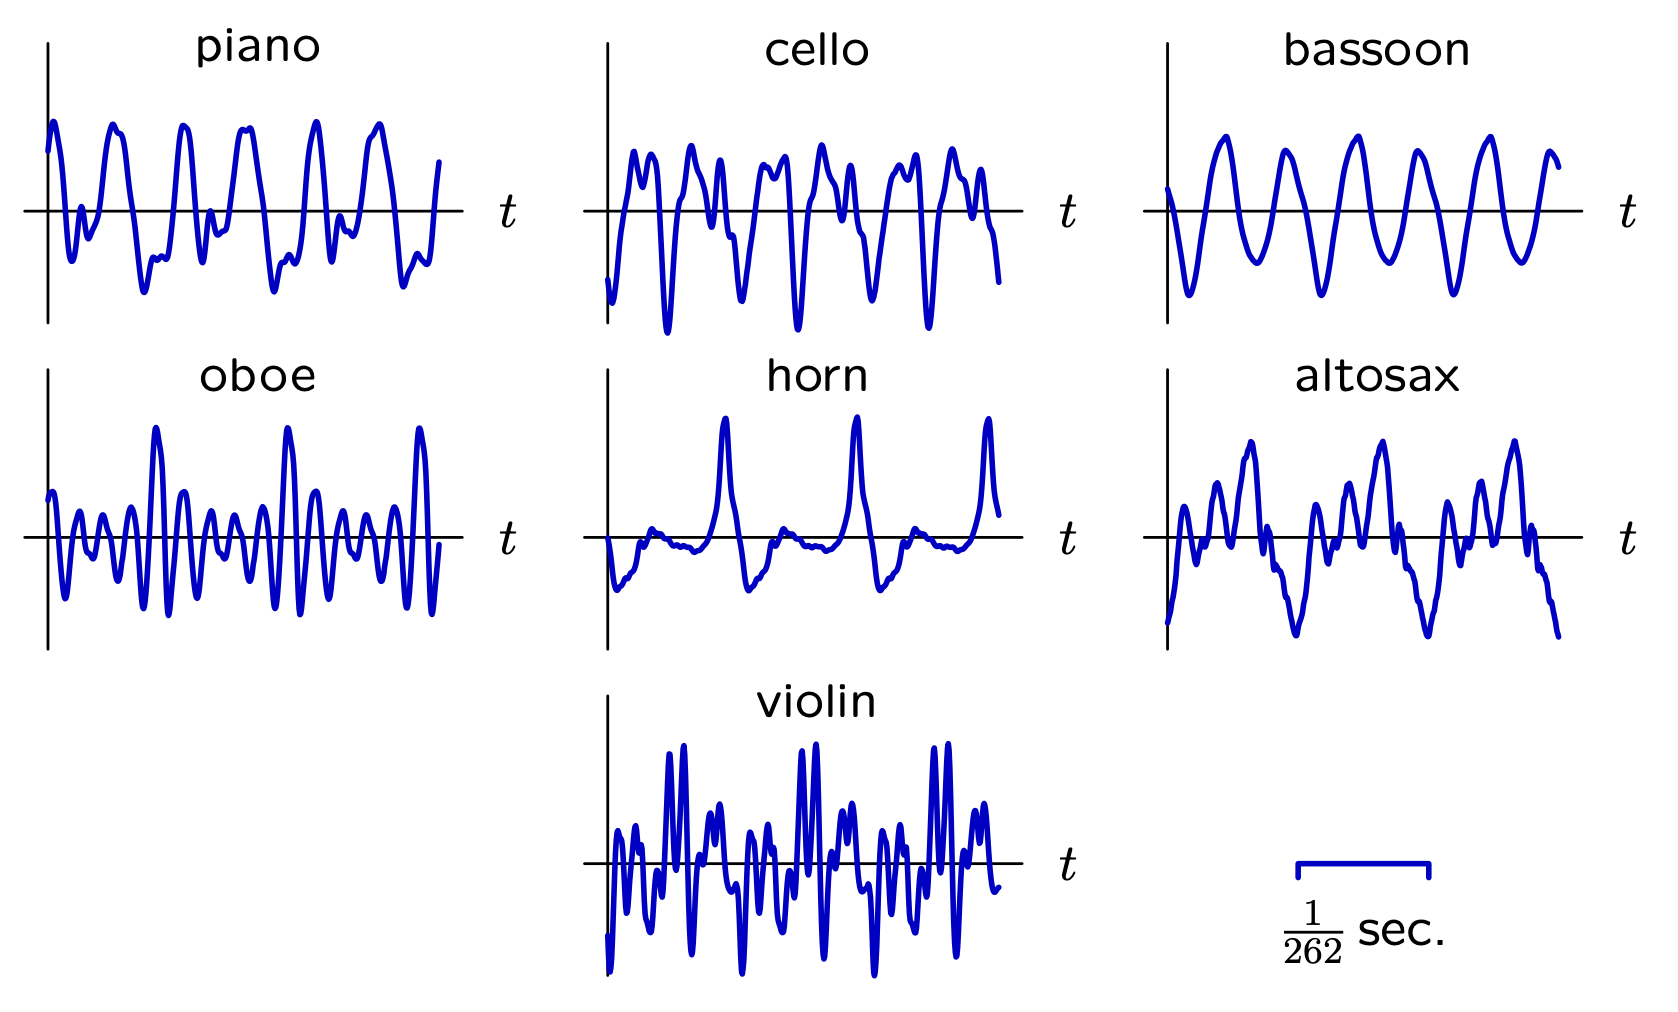
Consider the following graphs of air pressure over time detected by a microphone listening to different musical instruments.
Notice how each graph has the same period of 2621 seconds. Consequently, each instrument's sound has the same pitch: 262 Hz to be precise (or approximately C4). However, each instrument's sound has a different timbre. This is because the “shape” of each graph across a single period differs greatly.
Signal processing, spiritually, is the study of looking beyond just the pitch of a signal. How can we quantitatively describe the “shape” of a signal across one of its periods?
§ Lecture: Fourier Series
Here's the driving mathematical fact behind Fourier series.
Theorem. (Fourier Analysis) Any (sufficiently well-behaved) signal f(t) with period T can be expressed as a sum of sinusoids.
f(t)=k=0∑∞(ckcos(kω0t)+dksin(kω0t))
In the above, ω0:=T2π is the fundamental frequency, and the coefficients {ck}k=0∞ and {dk}k=0∞ are the following.
Proof: Handwaving: assume that f(t) can be expressed as a sum of sinusoids, then derive the formulas for {ck}k=0∞ and {dk}k=0∞.
The c0 coefficient is obvious. For the others, recall for any A,B∈Z+ that:
∫0Tcos(Aω0t)cos(Bω0t)dt=∫0T21cos((A−B)ω0t)+21cos((A+B)ω0t)dt={T/20 if A=B. otherwise. ∫0Tsin(Aω0t)cos(Bω0t)dt=∫0T21sin((A−B)ω0t)+21sin((A+B)ω0t)dt=0.∫0Tsin(Aω0t)sin(Bω0t)dt=∫0T21cos((A−B)ω0t)−21cos((A+B)ω0t)dt={T/20 if A=B. otherwise.
These imply the formulas. In some sense, there's a sort of orthogonal basis here or whatever. ■
Remark. The relationship ω0=T2π must not be broken! For example, if a signal has fundamental frequency ω0=10π, then we must have T=0.2, so its Fourier coefficients must be computed by integrating over an interval of length 0.2.
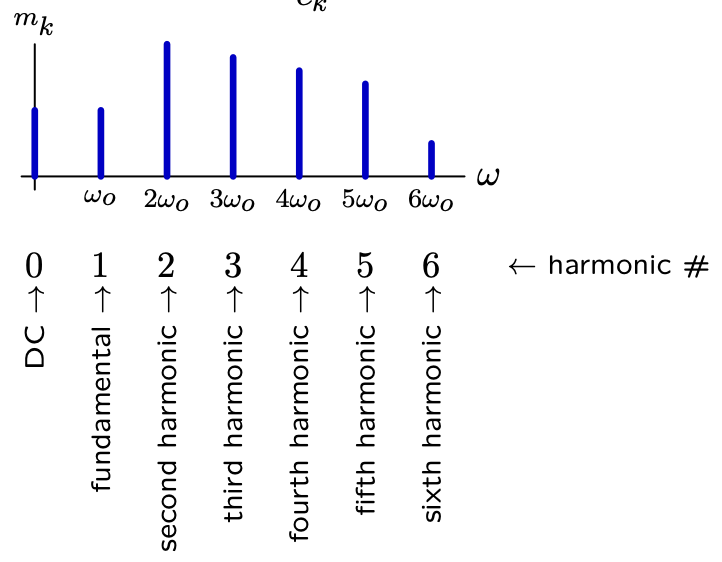
The fundamental frequency of a signal captures its pitch, but the coefficients {ck}k=0∞ and {dk}k=0∞ capture its timbre. So we might visualize the harmonic structure of a signal by plotting mk:=ck2+dk2 against the harmonic number k.
This tells us that the second harmonic of this signal is about twice as strong as its first harmonic (or fundamental).
Remark. The choice of plotting mk:=ck2+dk2 comes from the following rewrite.
f(t)==k=0∑∞(ckcos(kω0t)+dksin(kω0t))k=0∑∞mkcos(kω0t−ϕk) where mk:=ck2+dk2 and ϕk:=tan−1(ckdk).
So the measurement mk captures the strength of the part of the signal with frequency kω0.
Thus, there are two ways we can look at a signal:
As a function of time: f(t).
As a function of frequency: k↦(ω0,mk,ϕk).
§ Recitation: Computing Fourier Series
Recall that cos(t) is even and sin(t) is odd. Therefore,
If f(t) is even, then f(t)sin(kω0t) is odd for all k, so dk=0 for all k.
If f(t) is odd, then f(t)cos(kω0t) is odd for all k, so ck=0 for all k.
Thus, if a signal is known to be even or odd, its Fourier series can be computed in half the usual number of steps.
Problem. Determine the Fourier coefficients of f(t)=∣sin(t)∣.
Solution: This is even with period T=π and fundamental frequency ω0=2. Thus, dk=0 and: